SmartHelping / Unit Costs & Pricing / Excel
Cost per Unit Financial Model
Understand the cost behind each unit you sell. Enter direct and indirect costs, compare low, medium, and high sales volumes, and calculate a suggested selling price for your target profit margin.
Built for manufacturing and retail businesses that want a straightforward way to evaluate unit costs, pricing, and projected profit.
Immediate download after purchase. By purchasing, you agree to the Terms of Service.
Model walkthrough
See how costs, sales volumes, and margins shape pricing.
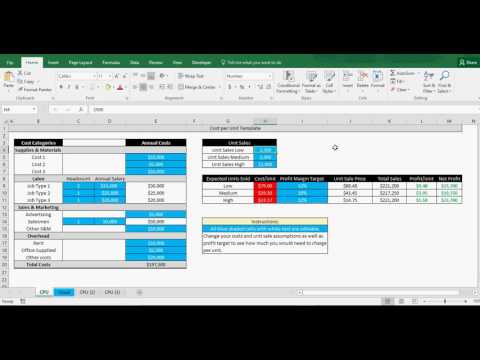
Explore the cost inputs, three sales-volume scenarios, suggested selling prices, and profit visuals before entering your own assumptions.
From total costs to a selling price
Evaluate unit economics across three sales scenarios.
Bring direct and indirect costs into the same analysis, then compare the relationship between sales volume, cost per unit, selling price, and profit.
Direct and indirect costs
Enter the costs that belong in your analysis so the unit-cost result reflects more than the direct cost of the item being sold.
Low, medium, and high sales volumes
Compare three unit-sales assumptions to see how the entered costs translate into cost per unit and projected results.
Suggested selling price
Calculate a selling price per unit from the modeled cost per unit and your desired profit-margin percentage.
Adjustable margin targets
Change the target profit percentage and review the resulting selling price to evaluate different pricing goals.
Sales, volume, and profit visuals
Review charts showing total sales, projected profit, and the number of units sold for the scenarios being analyzed.
Cost and profit per unit
Use the per-unit chart to compare the cost assigned to each unit with the profit generated at the modeled selling price.
Match costs to the units being sold
Build the analysis around sales units.
Enter the units you expect to sell and costs that correspond to those sales assumptions. Production volume and sales volume can differ, so use the sales-unit basis required by this template.
Unit sales are entered as assumptions; this version does not automatically derive them from variable costs. If your costs change between sales scenarios, make sure the cost assumptions represent the situation you want to evaluate.
Build your unit-cost analysis
Start with the costs, then test volume and margin.
-
Enter direct and indirect costs
Include the costs relevant to the units and sales assumptions you want to evaluate.
-
Set three sales-volume scenarios
Enter low, medium, and high expected unit sales and check that the cost assumptions match the analysis.
-
Choose a profit-margin target
Set the desired margin and review the automatically calculated selling price per unit.
-
Compare prices and projected results
Review sales, profit, unit volumes, and cost and profit per unit. Adjust the margin target to compare alternative selling prices.
Also included in the manufacturing collection
Explore more manufacturing and costing models.
The Cost per Unit Financial Model is included in the Manufacturing Financial Models Bundle.
Manufacturing Financial Models Bundle
Explore manufacturing forecasts, costing calculators, equipment investment analysis, sensitivity tables, and production tracking tools.
Explore the bundle →Supporting analysis and presentation tools
Test pricing assumptions and present the results.
Explore separate templates for volume discounts, manufacturing sensitivity, SaaS pricing, and financial charts.
Volume Discount Pricing Calculator
Compare volume discounts across starting prices and sales volumes to review revenue, gross profit, and operating income.
View template details →Manufacturing Productivity Sensitivity Tables
Compare how price, volume, costs, and labor efficiency affect profit and break-even targets across 21 Excel sensitivity tables.
View template details →SaaS Pricing & Margin Simulator
Compare ten customer configurations for pricing, contract terms, retention, service costs, lifetime value, acquisition cost, and payback.
View template details →Financial Visualizations for Pitch Decks
Turn annual financial figures into charts covering revenue, margins, customers, funding uses, and break-even performance in Excel or Google Sheets.
View template details →Common questions
Before you set your selling price.
Who is this model designed for?
Manufacturing and retail businesses that want to analyze direct and indirect costs per unit, compare sales volumes, and evaluate selling prices and profit margins.
How many sales scenarios are included?
The model includes low, medium, and high sales-volume scenarios.
Should I enter units produced or units sold?
Enter sales units. The model assumes that your entered costs correspond to the units you expect to sell in the analysis.
Does the model calculate unit sales from variable costs?
No. This version uses the unit-sales assumptions you enter. Custom logic for deriving sales or costs can be discussed as a separate customization.
How is the suggested selling price determined?
The model uses cost per unit and the target profit-margin percentage to calculate a selling price. Changing the margin target updates that suggested price.
Is the newer Absorption Costing template included?
No. The Absorption Costing template linked in the related section is a separate, more detailed product. This purchase is for the Cost per Unit Financial Model described on this page.
When can I download the workbook?
The Excel template is available to download immediately after purchase.
Price with your costs in view
Connect the cost of each sale to your profit goal.
Compare unit costs, sales-volume scenarios, and margin-driven pricing in one workbook. Need a tailored model? Contact Jason.
